
Article · Speakers
Get Guaranteed Media Listings With PMN / TalkPix
PMN / TalkPix is your lifetime marketing & fund raising partner. Together we market your projects, identify supporters & reward them to kee…
View DetailsIn recent years, headlines highlighting negative “n
In recent years, headlines highlighting negative “n
In recent years, headlines highlighting negative “net approval” ratings have become a routine feature of American political coverage.
During the presidency of Donald Trump, these numbers were frequently presented as historically alarming, raising questions about whether his ratings represented a unique collapse in public confidence or a broader structural shift in American politics. A closer, data-driven comparison across modern presidencies reveals a more nuanced picture.
While Trump’s net approval was persistently negative, its depth was not unprecedented when measured against past leaders during periods of crisis. What distinguishes the Trump era is not simply the numbers themselves, but the rigidity of voter alignment in an increasingly polarized electorate.
Understanding this distinction is essential to separating emotional reaction from structural political reality.
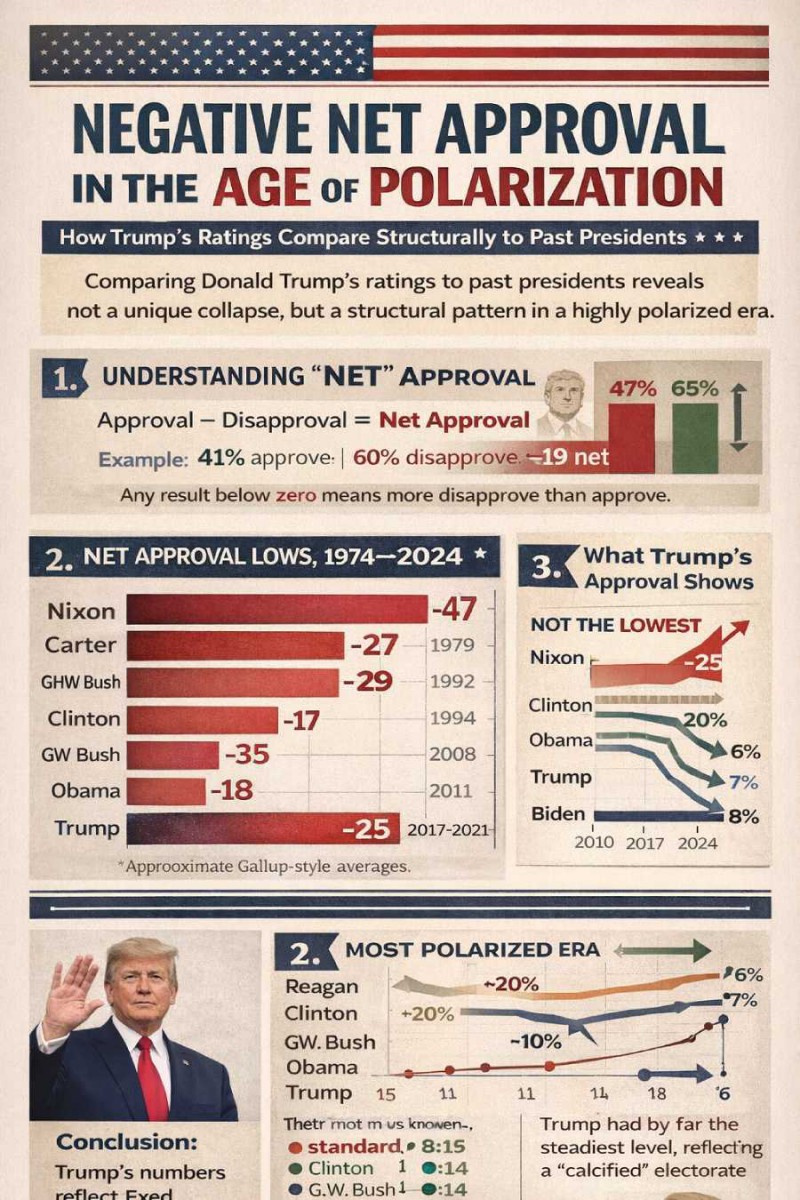
1️⃣ What “Net Approval” Actually MeansThe graphic you posted shows net approval, not raw approval.
Net approval = Approval % − Disapproval %
Example:
42% approve
61% disapprove
Net = −19
Negative net numbers are not new. They simply mean more people disapprove than approve.
{rsform 189}
2️⃣ Negative Net Approval Is Not NewMany presidents have had negative net approval periods:
George W. Bush during the Iraq War and financial crisis
Barack Obama during the ACA rollout and midterm backlash
Joe Biden during inflation spikes
What is different today is how persistent the negatives are.
Earlier presidents often dipped negative during crises but later recovered. Trump’s approval tended to stay tightly within a narrow band (roughly low 40s approval) for most of his presidency.
Political scientists sometimes call this the “calcified electorate” era.
3️⃣ Modern Polarization Is Historically ExtremeThe biggest structural change is partisan polarization:
Republicans overwhelmingly approve of Republican presidents.
Democrats overwhelmingly disapprove.
Very few voters move between those camps.
Since about 2008–2012, cross-party approval has collapsed. That makes it very hard for any president to reach broad national approval.
Trump governed during one of the most polarized periods in modern American political history.
4️⃣ Media & Reporting ChangesThere are reporting differences compared to earlier decades:
We now see:
Weekly national tracking polls
Aggregators
Constant “net approval” graphics
In the 1980s or 1990s, polling was less constant and less visually amplified.
Earlier eras emphasized:
“Approval rating is 47%”
Modern media emphasizes:
“Net approval is −12”
That framing makes negativity more visually stark.
5️⃣ Trump-Specific FactorsWhether one thinks he was “that bad” depends on political viewpoint, but objectively speaking, Trump had several attributes that historically depress cross-party approval:
Highly confrontational rhetoric
Norm-breaking governing style
Two impeachments
Pandemic-era turmoil
Strong opposition mobilization
He also had very high loyalty within his base, which kept approval from collapsing into the 20s (like Nixon late in Watergate).
6️⃣ Why It Feels Worse NowThree reasons:
Information saturation – you see polls constantly.
Net framing – negative numbers look dramatic.
Zero-sum politics – fewer persuadable voters.
In the 1990s, a president at 47% approval wasn’t described as being at “−6 net.” Today they are.
Is This A New TrickIt is not a new reporting trick, and it’s not unique to Trump.
What is unique:
The degree of polarization
The durability of negative net ratings
The nonstop visibility of polling
{rsform 189}
Comparative Net Approval Lows (Modern Era)| President | Lowest Net Approval | Approx. Year | Context Trigger |
|---|---|---|---|
| Richard Nixon | ~ −47 | 1974 | Watergate collapse |
| Jimmy Carter | ~ −27 | 1979–80 | Inflation, Iran hostage crisis |
| George H. W. Bush | ~ −29 | 1992 | Recession |
| Bill Clinton | ~ −17 | 1994 | Midterm backlash (before recovery) |
| George W. Bush | ~ −35 | 2008 | Iraq War + financial crisis |
| Barack Obama | ~ −18 | 2010 | ACA backlash / midterms |
| Donald Trump | ~ −21 to −25 | 2017–2020 | Persistent polarization |
| Joe Biden | ~ −22 to −25 | 2022 | Inflation spike |
Trump’s worst net ratings (~ −25 range) are:
Worse than Clinton and Obama
Similar to Carter
Less severe than George W. Bush in 2008
Nowhere near Nixon’s collapse
So structurally, Trump was not an outlier in depth.
Stability.
Most presidents follow a curve:
Honeymoon period
Crisis dip
Partial recovery
Trump’s approval:
Started polarized
Stayed polarized
Rarely moved outside a narrow 38–45% approval band
Political scientists often describe this as the “frozen electorate” era.
Average cross-party approval gap:
| Era | Opposing Party Approval of President |
|---|---|
| Reagan era | ~30–40% |
| Clinton era | ~20–30% |
| Obama era | ~10–15% |
| Trump era | ~5–8% |
| Biden era | ~5–10% |
That collapse in cross-party approval makes sustained negative net ratings more common.
Timeline Pattern (Simplified)The key structural difference is not severity — it is durability and lack of movement.
Trump’s negative net approval:
Was not unprecedented in depth.
Was unusually consistent.
Occurred in an era of historically high partisan polarization.
Is structurally similar to Biden’s pattern in terms of rigidity.
This suggests the phenomenon is systemic polarization, not merely reporting changes or uniquely catastrophic performance.
{rsform 189}